Expert insights on synthetic data
Blog posts
Thank you! Your submission has been received!
Oops! Something went wrong while submitting the form.
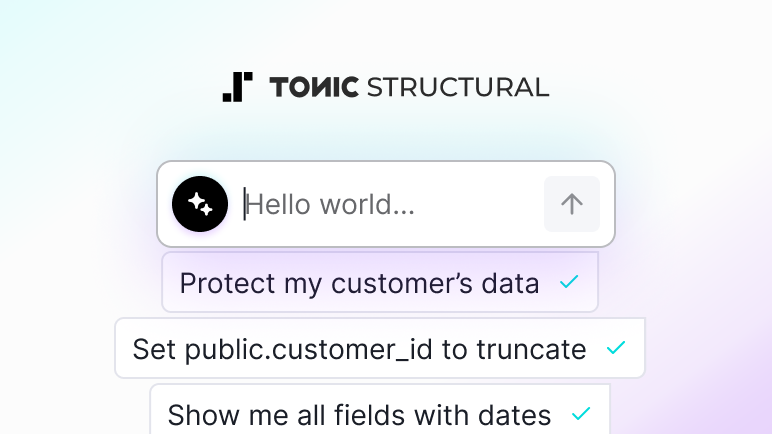
The agentification of Test Data Management is here. Meet the Structural Agent.
Data de-identification
Data de-identification
Test data management
Product updates
Tonic Structural

Data synthesis
Generative AI
Technical deep dive
Tonic Fabricate
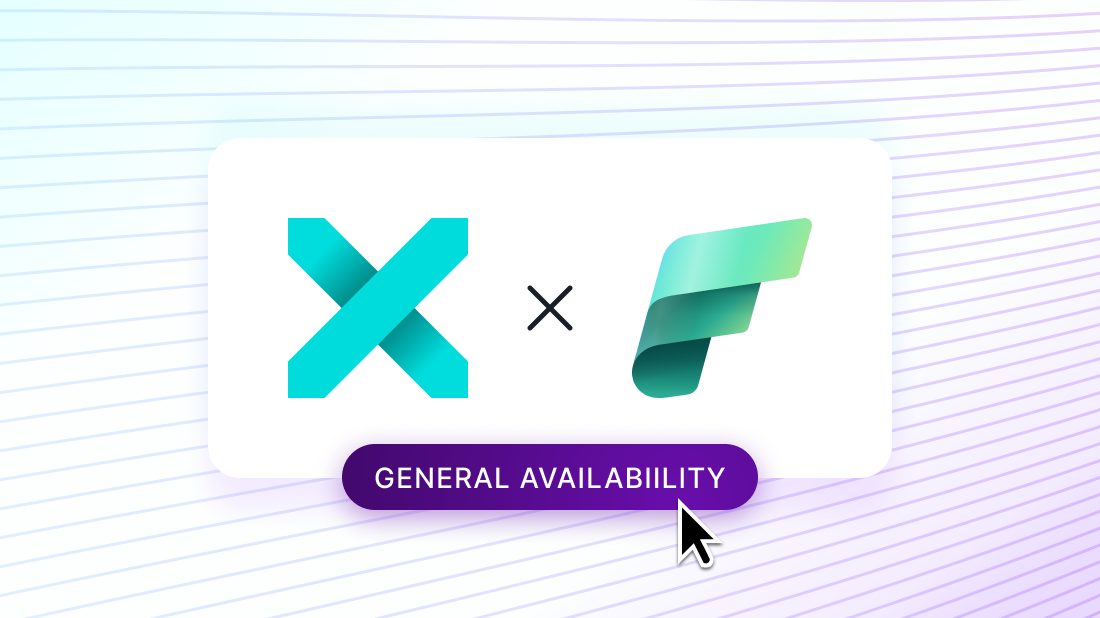
From off-limits to AI-Ready: Preparing unstructured data directly in Microsoft Fabric with Tonic Textual
Product updates
Data de-identification
Product updates
Generative AI
Tonic Textual

Data privacy
Data de-identification
Tonic Structural
Tonic Textual
Test data management
Generative AI
Technical deep dive
Tonic Textual

Product updates
Data de-identification
Tonic Textual
Product updates
Data de-identification
Tonic Textual
Product updates
Generative AI
Tonic Textual
Generative AI
Data privacy
Tonic Textual
Data privacy
Generative AI
Financial services
Tonic Textual
.png)
Test data management
Data de-identification
Tonic Structural
Tonic Fabricate