Synthetic data generation is the process of creating artificial data that resembles real-world data. This data can be generated using a variety of methods and techniques, depending on the needs of the use case at hand. These methods aim to ensure that the synthetic data maintains the statistical properties and patterns of real-world data without containing any actual personal or sensitive information.
Among its key use cases, synthetic data proves valuable in software development and testing, as well as AI model training, especially in environments where using real production data poses privacy risks or regulatory challenges. It allows for rigorous, comprehensive testing without the privacy concerns associated with real customer data, and is much more effective at finding bugs and quality concerns than with test data built by hand. By generating synthetic data, developers can build, test, and validate their applications more effectively, ensuring high-quality releases while safeguarding consumer privacy.
Techniques for synthetic data generation
At a high-level, traditional methods of synthetic data generation can be grouped into two broad categories: rule-based data synthesis and statistical or model-based techniques.
Rule-based data synthesis involves generating synthetic data through predefined rules and logic, providing high control, flexibility, and customization. In certain instances, it can mean generating data “from scratch”, not involving or relying on any real-world data in its data generation process. In other instances, the rules are applied to existing data to transform it according to specific requirements. This method is ideal for scenarios where strict adherence to business rules is necessary and the data structures to be created are straightforward, though it can involve more manual configuration than model-based approaches.
In contrast, statistical or model-based approaches rely on real-world data and deep learning in their generation processes. Real-world data acts as a seed used by statistical models and algorithms to build a model capable of generating synthetic data that mirrors the underlying properties and distributions of the real data. These methods, including machine learning techniques like GANs and VAEs, can produce highly realistic synthetic data, making them suitable for machine learning training and privacy-preserving data analysis.

While these methods offer greater realism, they can be computationally intensive and provide less granular control over specific data attributes compared to rules-based methods. What’s more, current capabilities run into serious limitations when applied to complex databases involving multiple tables. In short, GANs and VAEs work well on smaller, individual tables but are not yet able to fully synthesize multiple tables with cross-table interdependencies.
Traditional methods
The below methods offer a few examples of traditional techniques to create synthetic data.
- Random sampling: One of the simplest methods, random sampling involves generating data points by randomly selecting values from a predefined distribution. While easy to implement, this method may not capture the complexities and correlations present in real-world data.
- Conditional data generation: This rule-based approach generates data “from scratch” based on predefined conditions or rules that reflect domain-specific knowledge or business logic. For example, a rule might constrain a data type’s range or format to generate values that fall within specific ranges or adhere to certain formats, like a credit card number. The goal is to create synthetic data that behaves similarly to real-world data in specific contexts, which requires a specific and thorough understanding of what the data should look like and how it should behave, making it useful for individual columns but unsuitable as a blanket approach for synthesizing complete datasets.
- Data transformation: Data transformation involves taking existing data and applying various mathematical or statistical operations to create new data points. For example, you can generate synthetic sales data by applying formulas to real sales figures. This method is useful for creating data for specific scenarios, especially when the data follows repeatable trends.
- Data augmentation: Commonly used in image and text data generation, data augmentation involves applying transformations (e.g., rotation, translation, noise addition) to existing data to create new synthetic samples. This is particularly useful in machine learning to increase the diversity and size of training datasets.
Advanced techniques
Advanced techniques leverage machine learning and deep learning models to generate more realistic and complex synthetic data, without relying on rules defined by a user. As mentioned above, these techniques work well for smaller datasets or applied to a single table but are not currently capable of synthesizing multiple tables or full databases.
- Generative Adversarial Networks (GANs): GANs consist of two neural networks—a generator and a discriminator—that work in tandem. The generator creates synthetic data, while the discriminator evaluates its authenticity. Through this adversarial process, GANs can generate highly realistic synthetic data that closely resembles real-world data.
- Variational Autoencoders (VAEs): VAEs are another type of neural network used for synthetic data generation. They work by encoding real data into a latent space and then decoding it back into synthetic data. VAEs are particularly effective for generating continuous data and can capture complex data distributions.
- Markov chains: Markov chains are used to generate sequences of data where each data point depends on the previous one. This method is often used for generating time-series data, text, or sequences of events that exhibit a certain pattern.
In the realm of test data synthesis for software development, most teams find that they require a combination of techniques to effectively craft the realistic data they need. Some data types are better served by rule-based approaches, while others cannot accurately be synthesized without a deep learning algorithm to properly capture the data’s statistical distributions. The solution required is one that brings all options to the table, so that teams can mix and match approaches to generate high-quality, high-utility data. Next, we’ll look at best practices in implementing these approaches across the board.
Best practices for generating synthetic data
Ensure data privacy and utility
Prioritizing data privacy in generating synthetic data involves a variety of best practices to ensure both the utility of the data and the protection of sensitive information. Here are some key practices to stay on top of:
- Understand the source data: Before generating synthetic data, fully understand the characteristics, distributions, and dependencies in the original data. This understanding will help ensure that the synthetic data maintains the statistical properties necessary for valid testing and development.
- Implement advanced data synthesis techniques: Incorporate mechanisms like differential privacy which adds randomness to the data-generating process to minimize the risk of re-identifying individuals from the source dataset. Note that differential privacy naturally softens outliers, so it can remove edge cases from a dataset which may be important to have for fully representative software testing.
- Validate synthetic data quality and variety: Regularly test your synthetic data against real scenarios to confirm that it retains the essential characteristics of original data for your use case. Synthetic data should include realistic variations to effectively mimic real-world scenarios, like edge cases or rare occurrences found in your original data. Likewise, make use of tools and methodologies to evaluate the risk of re-identification or information leakage from your synthetic data.
- Preserve data relationships: Ensure that relationships between variables (e.g., correlations, hierarchies) are maintained in the synthetic data. For statistical data, deep learning methods can be helpful here. For relational data more broadly speaking, the ability to link columns and ensure consistency throughout your database is essential.
- Continuously monitor and update: Regularly monitor the use and performance of your synthetic data to identify any unexpected behavior or potential privacy concerns. Adjust your data synthesis methods as new vulnerabilities are discovered or as compliance requirements change.
- Comply with legal standards: Ensure that your generation and use of synthetic data comply with all relevant data protection regulations (including GDPR, HIPAA, CCPA, etc.) and ethical guidelines.
- Documentation and transparency: Maintain thorough documentation of your data synthesis processes, including the techniques used, the rationale for their selection, and any implications for data privacy. Audit trails are a must.
Scaling up synthetic data generation processes
The demand for synthetic data is only set to grow, so your generation processes need to be optimized to scale efficiently:
- Automation: Implement automated pipelines for generating synthetic data at scale. This includes using tools and platforms that support automated data synthesis and data provisioning to manage your workflows, especially when dealing with large datasets or complex generation tasks.
- Parallel processing: Leverage parallel processing techniques to improve efficiency and speed by distributing the data generation tasks across multiple processors or machines.
- Batch processing: For extremely large datasets, consider using batch processing for bulk data generation tasks.
- Utilize scalable infrastructure: Employ scalable cloud-based solutions or high-performance computing environments to handle the computation-heavy tasks of data synthesis, especially when using advanced techniques like deep learning models. This allows for dynamic allocation of resources based on the workload.
Synthesize your data for software testing and AI model training.
Unblock product innovation with high-fidelity synthetic data that mirrors your data's context and relationships.
Tools for synthetic data generation
Choosing the right tools for synthetic data generation is crucial for achieving high-quality results. Several open-source and commercial products are available to help developers generate synthetic data from real data efficiently and securely, including Tonic.ai’s industry-leading solutions. Below are several pioneering tools in the market:
Commercial tools
- Tonic.ai
- Tonic Fabricate: Tonic Fabricate is a platform for generating synthetic data from scratch via agentic AI. Chat with the Fabricate Data Agent to build and iterate on your ideal dataset, whether it’s a relational database, PDFs, docx files, or a myriad of other unstructured data types. Leverage the vast domain expertise of LLMs to achieve unprecedented realism in a matter of minutes, then rapidly export your data in the format you need.
- Tonic Structural: Tonic Structural specializes in generating synthetic data from structured and semi-structured data for software development and testing. It offers PII detection, de-identification, synthesis, and subsetting, by way of an intuitive UI and extensive database support. Structural streamlines the process of generating realistic test data on demand, to ensure that developers can work with high-fidelity data that mirrors production data without risking data privacy.
- Tonic Textual: Tonic Textual focuses on synthesizing unstructured free-text data for AI development. It uses proprietary Named Entity Recognition (NER) models to identify and redact or replace sensitive data entities, ensuring that proprietary data is protected. Tonic Textual transforms various unstructured data formats into AI-friendly formats, streamlining the ingestion and vectorization processes for LLM training and enterprise RAG systems.
- DataGen: DataGen specializes in generating synthetic data for computer vision applications. It creates high-fidelity 3D simulations to generate diverse and annotated image data, helping AI developers train and validate their models with realistic synthetic data.
- MDClone: MDClone offers synthetic data solutions tailored for the healthcare industry, enabling secure data analysis and research. Their platform allows healthcare organizations to create synthetic versions of their data, facilitating innovation while protecting patient privacy.
Open-source tools
- SDV (Synthetic Data Vault)
- SDV is an open-source library that provides a suite of tools for generating synthetic data from real data. It supports various data types and offers multiple generative models, including GANs and VAEs. SDV allows users to fit models to real data and generate new synthetic datasets while preserving the statistical properties of the original data.
- Synthea
- Synthea is an open-source synthetic patient generator that models the medical histories of synthetic patients. It is particularly useful for healthcare applications, providing realistic synthetic health records that can be used for research, testing, and training machine learning models.
- PrivBayes
- PrivBayes is an open-source tool that generates synthetic data using a differentially private Bayesian network. It aims to preserve the privacy of the original data while ensuring that the synthetic data retains its utility for analysis and modeling purposes.
Comparison of tools
When selecting a tool for synthetic data generation, consider the following factors:
- Data type and source support: Ensure that the tool supports the types and sources of data you are working with, whether structured, semi-structured, or unstructured, and stored on-premises or on the cloud.
- Usability and integration: Look for tools that offer an intuitive user interface and can easily integrate with your existing data pipelines and workflows.
- Scalability: Ensure that the tool can handle large datasets and scale up to meet your data generation needs.
- Privacy and compliance: Check that the tool provides robust privacy protection features that will enable you to comply with relevant data protection regulations.
Case studies: Using synthetic test data in testing
At Tonic, we’ve seen time and time again how having a strong strategy around creating synthetic, combined with the best tools, leads to real and meaningful results.
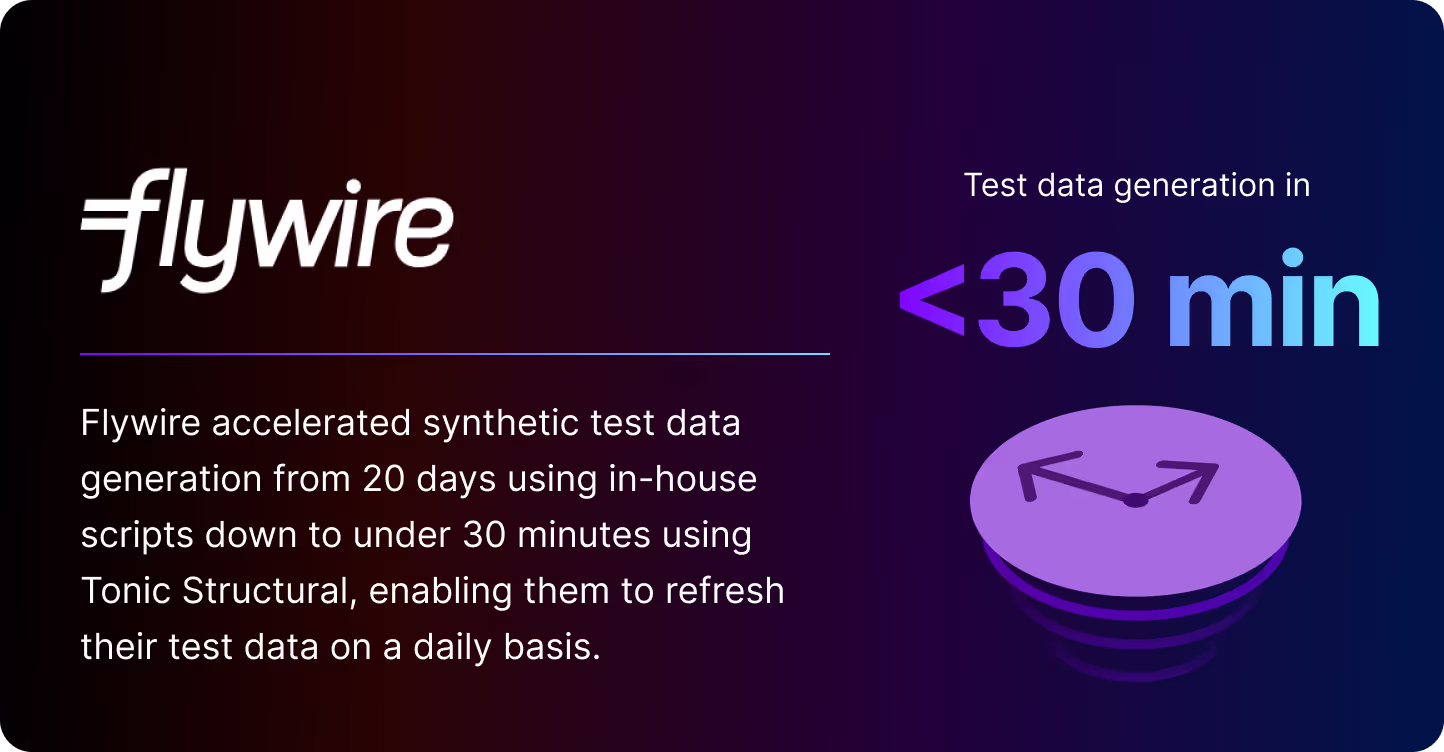
With Flywire, they found themselves challenged by the constraints of HIPAA regulation leading to an initial attempt using in-house scripts to build data from scratch. These scripts were time consuming and difficult to maintain, and creating a synthetic data set would take 40 hours at the minimum — and 20 days for the full dataset! Like many of our customers, they have diverse data sets across many different types of databases along with a complex set of services in AWS that utilized them. By utilizing a specialized tool like Tonic that could generate synthetic data for all of their data sources in a realistic and consistent manner, Flywire can now spin up a new environment in minutes leading to on demand test data environments being built upwards of several times a day.
Flexport is an example where both scale and having 30+ teams using synthetic data makes data generation a challenging engineering problem. As is similar to many other companies, a single in-house tool quickly became outdated, archaic, and insufficient for meeting the goals of engineering teams. By utilizing Tonic, they were able to heavily automate test data generation by running it in line with their schema migration process multiple times a day. Not only is the data consistently up to date with production data, but developers can each have their own on-demand databases to work on and test important features and bug fixes in development.
Paytient very quickly saw that by prioritizing a valuable solution led to significant results. With a large trove of highly sensitive payment and health data, they found building a successful tool was far beyond the capabilities of an engineering team their size, and struggled to have a solution that was beneficial to developers and product support. Using a highly configurable and automated system like Tonic allowed the team to save hundreds of hours, and ultimately return a 3.7x ROI while increasing the quality of life for everyone using the data on a daily basis. In addition, they took a much lower risk of building a system themselves where PII could be more easily introduced into lower environment.
All of these organizations had the same problems: complex data sets, the need for high quality data, privacy and security concerns, and a great deal of complexity that was only solved by using purpose built tools for the problem.
Generating synthetic data to accelerate innovation
Realistic data synthesis is not achieved by a one-size-fits-all approach. It requires a combination of traditional and advanced techniques, underpinned by best practices to ensure data utility, privacy, quality, and scalability. Solutions like, Tonic Fabricate, Tonic Structural, and Tonic Textual empower software and AI developers to create synthetic data tailored to their specific needs and use cases.
By equipping themselves with the right combination of tools, developers can unlock the full potential of synthetic data in their workflows, uplevelling testing and accelerating software and AI development to meet the speed that innovation requires. Connect with our team to learn more about how our solutions fulfill your data synthesis needs.